How to import a Leapfrog geological model to Model Muse with Python - Tutorial
/
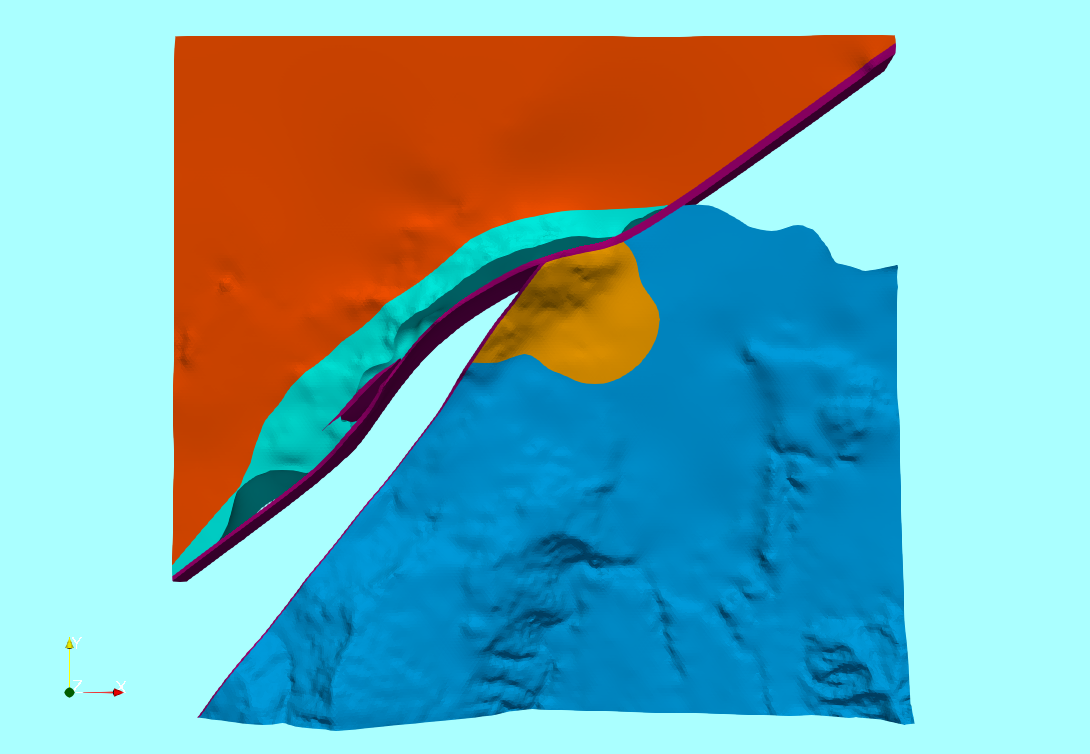
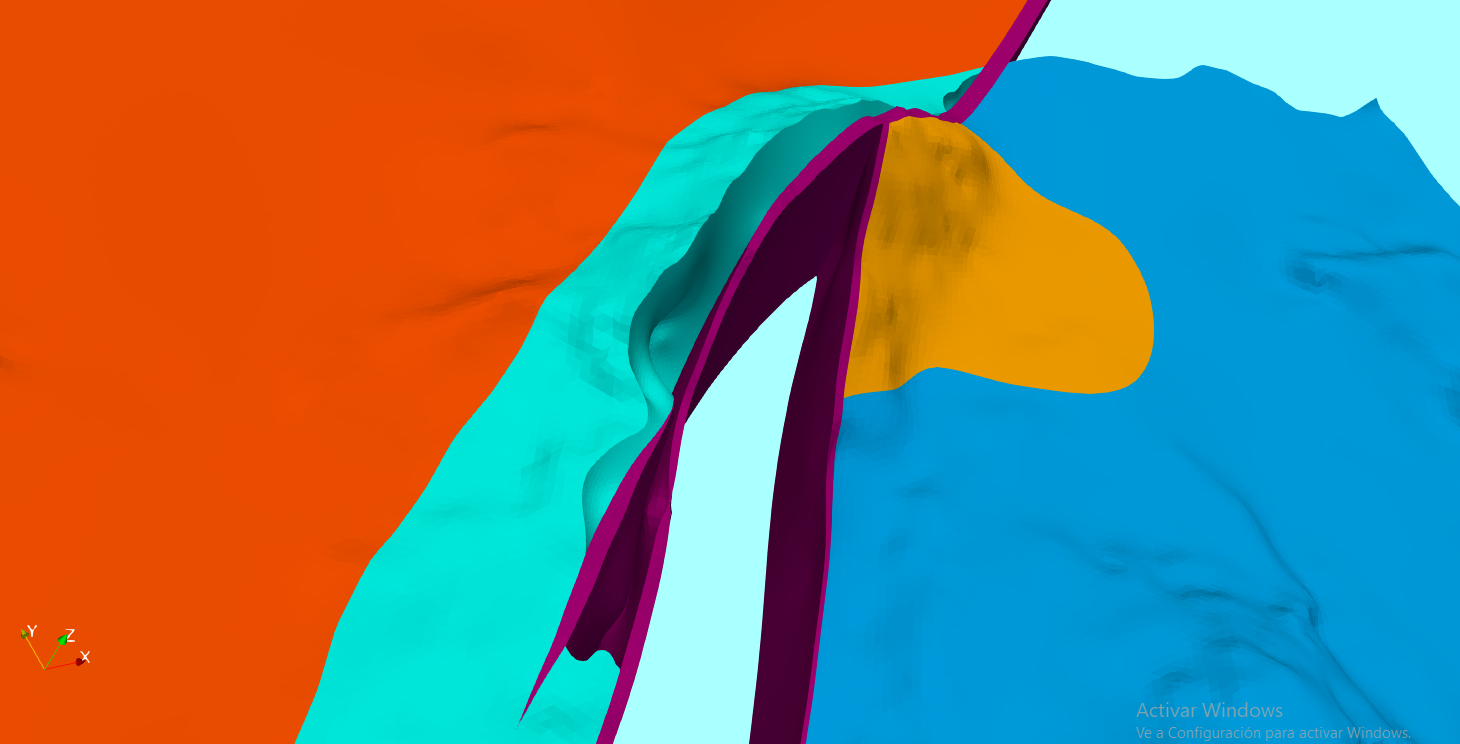
Having a geological model can enhance numerical models since it allows to represent higher accuracy the potential distribution of hydraulic parameters in the horizontal and vertical direction. The process to implement/insert a geological model into a Modflow model is a challenge due to restrictions on proprietary software and spatial tools; we have done the whole procedure to insert a geological model into a MODFLOW-NWT groundwater model with scripts in Python, Pyvista and others.
The code extracts the cell centroids of the modflow model and then compares its position with the different geological units exported from Leapfrog to Vtk. Once the corresponding lithology of the cell is identified a hydraulic parameter is assigned. The tutorial works from Vtks of a geological model done in Leapfrog, but it can work with any Vtk.
The tutorial requires another tutorial for the generation of Vtks from a Leapfrog model:
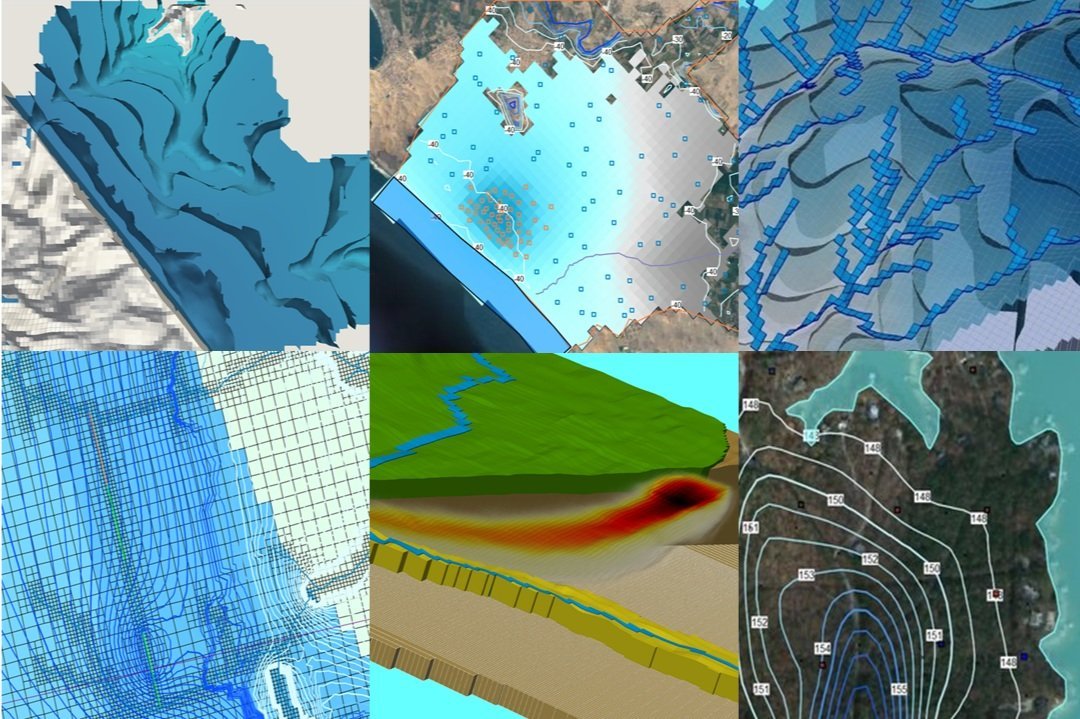
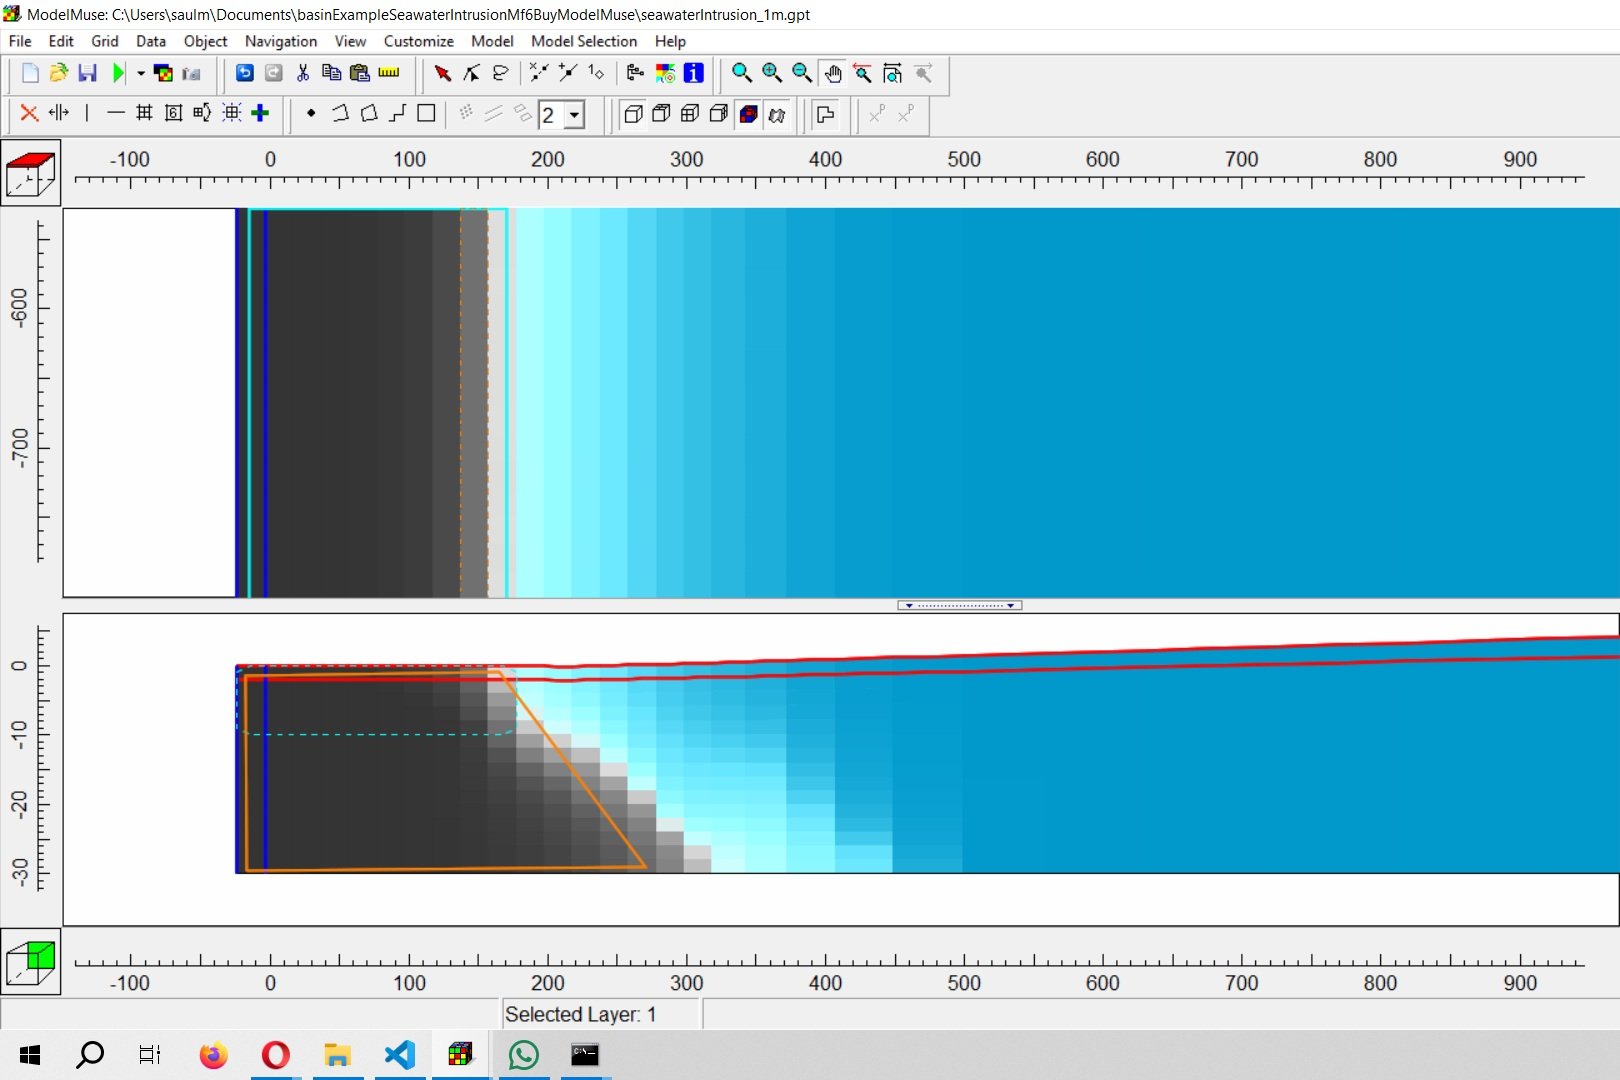
Screenshots
Tutorial
Code
# Import required models
import os
import flopy
import numpy as np
import pyvista as pv
import matplotlib.pyplot as plt
from matplotlib.colors import LogNorm
# Open modflow model
modWs = '../Model/'
mf = flopy.modflow.Modflow.load('Model1.nam',model_ws=modWs)C:\Users\saulm\anaconda3\Lib\site-packages\flopy\mbase.py:85: UserWarning: The program mf2005 does not exist or is not executable.
warn(# Set coord info for spatial query
# From Model1.dis
# Lower left corner: (1444500, 5246300)
mf.modelgrid.set_coord_info(1444500, 5246300)# Convert the cell centers into a flattened numpy array
xyzCellList = mf.modelgrid.xyzcellcenters
# for x,y,z
xArray = np.tile(xyzCellList[0],(mf.modelgrid.nlay,1)).flatten()
yArray = np.tile(xyzCellList[1],(mf.modelgrid.nlay,1)).flatten()
zArray = xyzCellList[2].flatten()
# stack x, y, z columns
xyzCells = np.column_stack([xArray,yArray,zArray])
xyzCells.shape(3040000, 3)# Transform xyz list to a Pyvista polydata
xyzPoly = pv.PolyData(xyzCells)
xyzPoly| PolyData | Information |
|---|---|
| N Cells | 3040000 |
| N Points | 3040000 |
| N Strips | 0 |
| X Bounds | 1.445e+06, 1.448e+06 |
| Y Bounds | 5.246e+06, 5.250e+06 |
| Z Bounds | -1.467e+02, 7.011e+02 |
| N Arrays | 0 |
Working with Vtks and appliying spatial queries
# Get all vtks from directory and assign a correlative id
litoDict = [{'unit':unit,'vtk':vtk} for unit, vtk in enumerate(os.listdir('../Vtk')) if vtk.endswith('.vtk')]
#litoDict = litoDict[:1]
litoDict
[{'unit': 0, 'vtk': 'brecciaMsh.vtk'},
{'unit': 1, 'vtk': 'dykeMsh.vtk'},
{'unit': 2, 'vtk': 'granoMsh.vtk'},
{'unit': 3, 'vtk': 'marbleMsh.vtk'},
{'unit': 4, 'vtk': 'sandMsh.vtk'}]#create a list with a default lito code (5)
compLitoList = [5 for x in range(mf.modelgrid.size)]
len(compLitoList)3040000#we iterate over all litos to assign the lito values
for lito in litoDict:
#open the vtk file for the selected lito
tempVtk = pv.read('../Vtk/'+lito['vtk'])
#check if points are inside the vtk object
checkPoints = xyzPoly.select_enclosed_points(tempVtk)
#get only the inside points
insidePointsIndex = np.nonzero(checkPoints['SelectedPoints']==1)[0]
#assign the lito code to the compound lito list
for pointIndex in insidePointsIndex:
compLitoList[pointIndex] = lito['unit']#now we can have a look of the lito at model grid scale
compLitoArray = np.array(compLitoList)
compLitoArray = np.reshape(compLitoArray,[mf.modelgrid.nlay,
mf.modelgrid.nrow,
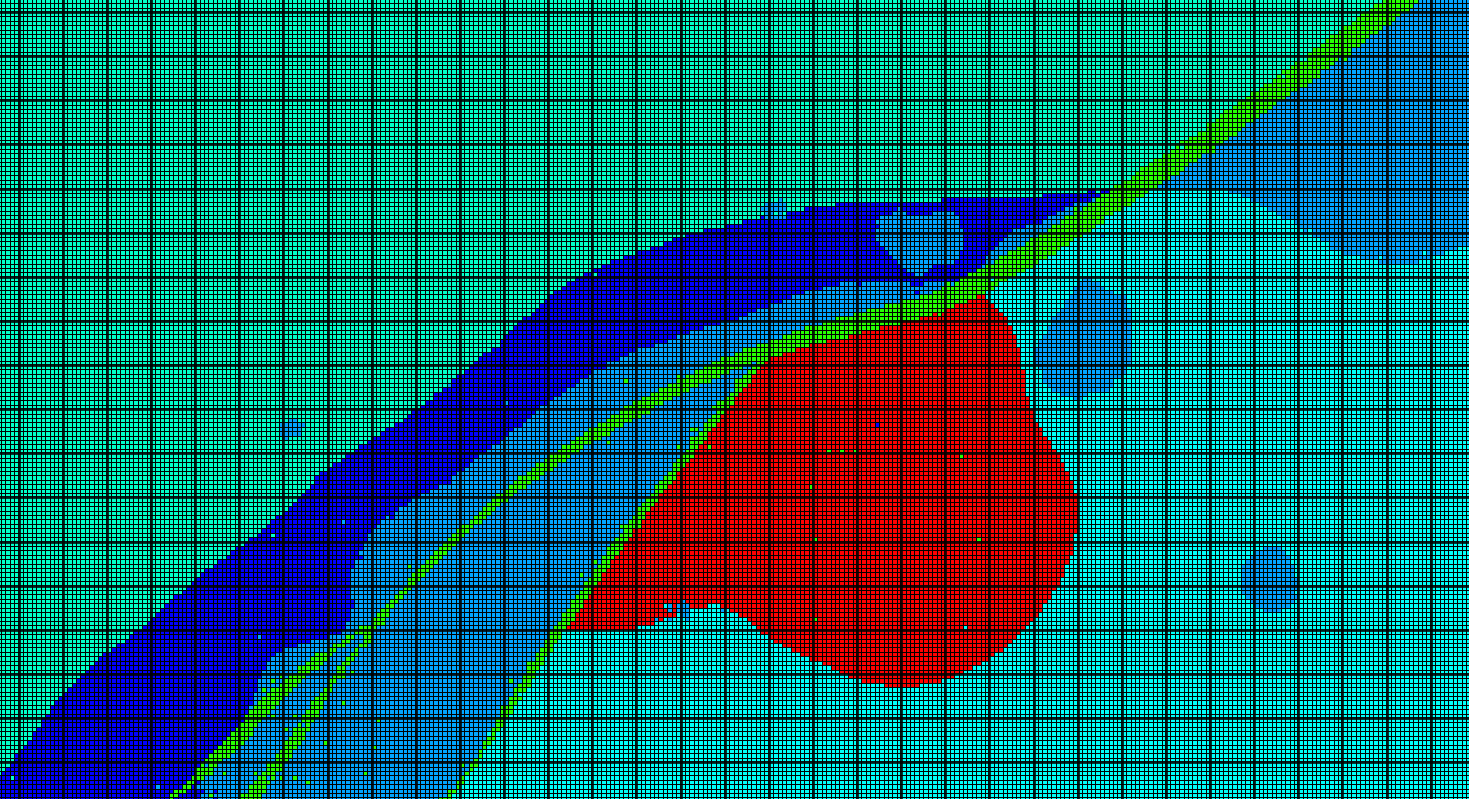
mf.modelgrid.ncol])#show array distribution
plt.imshow(compLitoArray[5])<matplotlib.image.AxesImage at 0x1fb4cdcedd0>
Applying parameters to model
# Open the modflow package that stores hydraulic parameters
lpf = mf.get_package('LPF')
hkArray= np.copy(lpf.hk.array)
hkArray.shape
(20, 380, 400)# Define the k values for every lito code
kDict = {
0:6.5e-4,
1:3.6e-6,
2:2.5e-7,
3:1.6e-8,
4:5.4e-7,
5:5.8e-8
}# ov
for lay in range(mf.modelgrid.nlay):
for row in range(mf.modelgrid.nrow):
for col in range(mf.modelgrid.ncol):
litoCode = compLitoArray[lay,row,col]
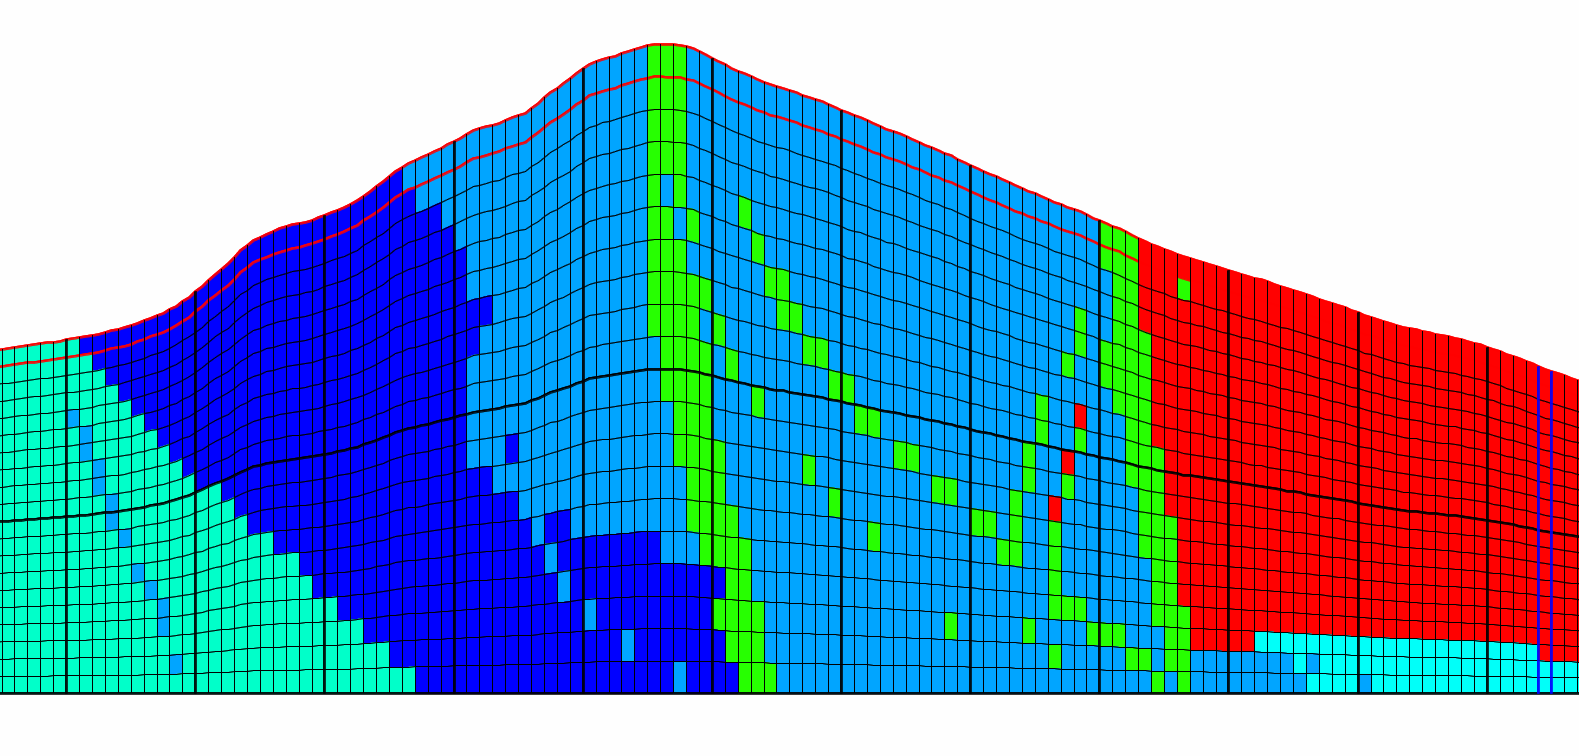
hkArray[lay,row,col] = kDict[litoCode]#show applied values
plt.imshow(hkArray[5], norm=LogNorm())
plt.show()
# Change working directory to store modified model
mf.change_model_ws('../workingModel/')
# Apply k values as an array
lpf.hk = hkArray
# Show applied values
lpf.hk.plot(mflay=10, norm=LogNorm())
plt.show()
mf.write_input()Input data
You can download the input data from this link.