VOCs and PFAs Interactive Spatiotemporal Representation with Python and Folium - Tutorial
/
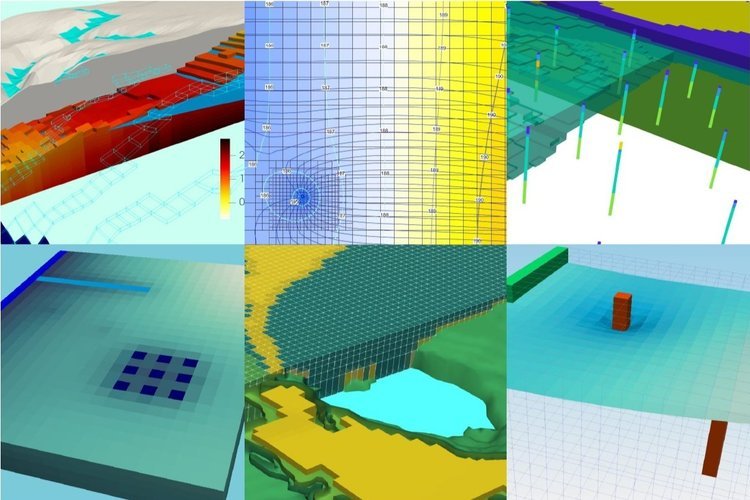
Analysis of groundwater chemistry is a difficult task for the limited set of monitoring samples, the limited samples and the limited analized components. In order to assess the actual extension of a contamination plume or the efficiency of remediation techniques we need new and innovative methods to plot and analyze water chemistry data with open source data. We have done an applied case of interactive VOCs and PFAs representation on a Jupyter notebook with Python, Folium and Ipywidgets. The dataset has more than 3300 samples of 127 points over a period of 30 years and corresponds to a contaminated site of a former airfield.
Install Ipywidgets on Jupyterlab following the instructions from this link:
ipywidgets.readthedocs.io/en/latest/user_install.html
Video
Animation
Python code
This is the Python code for the tutorial:
import numpy as np
import pandas as pd
import folium
from ipywidgets import interact, fixed, SelectionSlider
obsLoc = pd.read_csv('../Csv/obsLoc_v2.csv', index_col=0)
obsLoc.head()obsData = pd.read_csv('../Txt/NAWC_GWquality_Filter.txt',delimiter='\t',
parse_dates=[3], na_values=['NA','NS','NR'])
obsData.dtypesmIndex = pd.MultiIndex.from_frame(obsData[['NWIS_SiteNumber','SampleDate']],
names=['Number','Date'])
obsData.index = mIndex
obsData.head()#get values for map location
lonMean = obsLoc.lon.mean()
latMean = obsLoc.lat.mean()
print(latMean,lonMean)#show all monitoring points
m = folium.Map(location=[latMean,lonMean],zoom_start=15)
for index,row in obsData.iterrows():
try:
lat, lon = obsLoc.loc[index[0]].values
folium.CircleMarker(location=[lat, lon], radius=2).add_to(m)
except KeyError:
pass
m# sample of group samples by month
monthData = obsData.groupby(by=['NWIS_SiteNumber',pd.Grouper(freq='M', level=1)]).mean()
monthData.iloc[[0]]#list of sampling dates
uniqueDates=pd.unique(monthData.index.get_level_values(1))
uniqueDates = np.sort(uniqueDates)
uniqueDates.shape#list of components
compList = [a for a in monthData.keys().to_list() if 'per_liter' in a]
compList# filter dataframe by component values
monthData[monthData['PFUnA_nanograms_per_liter']>0]#plot function for given time
def plotConcentrations(monthData,component,date,zoomLevel):
#initalize map
m = folium.Map(location=[latMean,lonMean],zoom_start=zoomLevel)
#filter by date:
tempDf = monthData[monthData.index.get_level_values(1) == date]
tempDf = tempDf[[component]]
#maxCon = monthData[component].max()
for index,row in tempDf.iterrows():
try:
lat, lon = obsLoc.loc[index[0]].values
folium.CircleMarker(location=[lat, lon],
radius=np.log(row[component]+0.001),
popup=component +'='+str(row[component]),
opacity=0.4,
fill=True,
fill_opacity=0.8).add_to(m)
except KeyError:
pass
return m#plot concentration for a given date
plotConcentrations(monthData,'VC_micrograms_per_liter',uniqueDates[30],zoomLevel=15)#plot function for given time
def plotSelectedConcentrations(monthData,component,zoomLevel):
tempDf = monthData[monthData[component]>0]
uniqueDates=pd.unique(tempDf.index.get_level_values(1))
uniqueDates = np.sort(uniqueDates)
interact(plotConcentrations, monthData=fixed(monthData), component=fixed(component),
date=SelectionSlider(options=list(uniqueDates)),
zoomLevel=fixed(zoomLevel));# plot one component
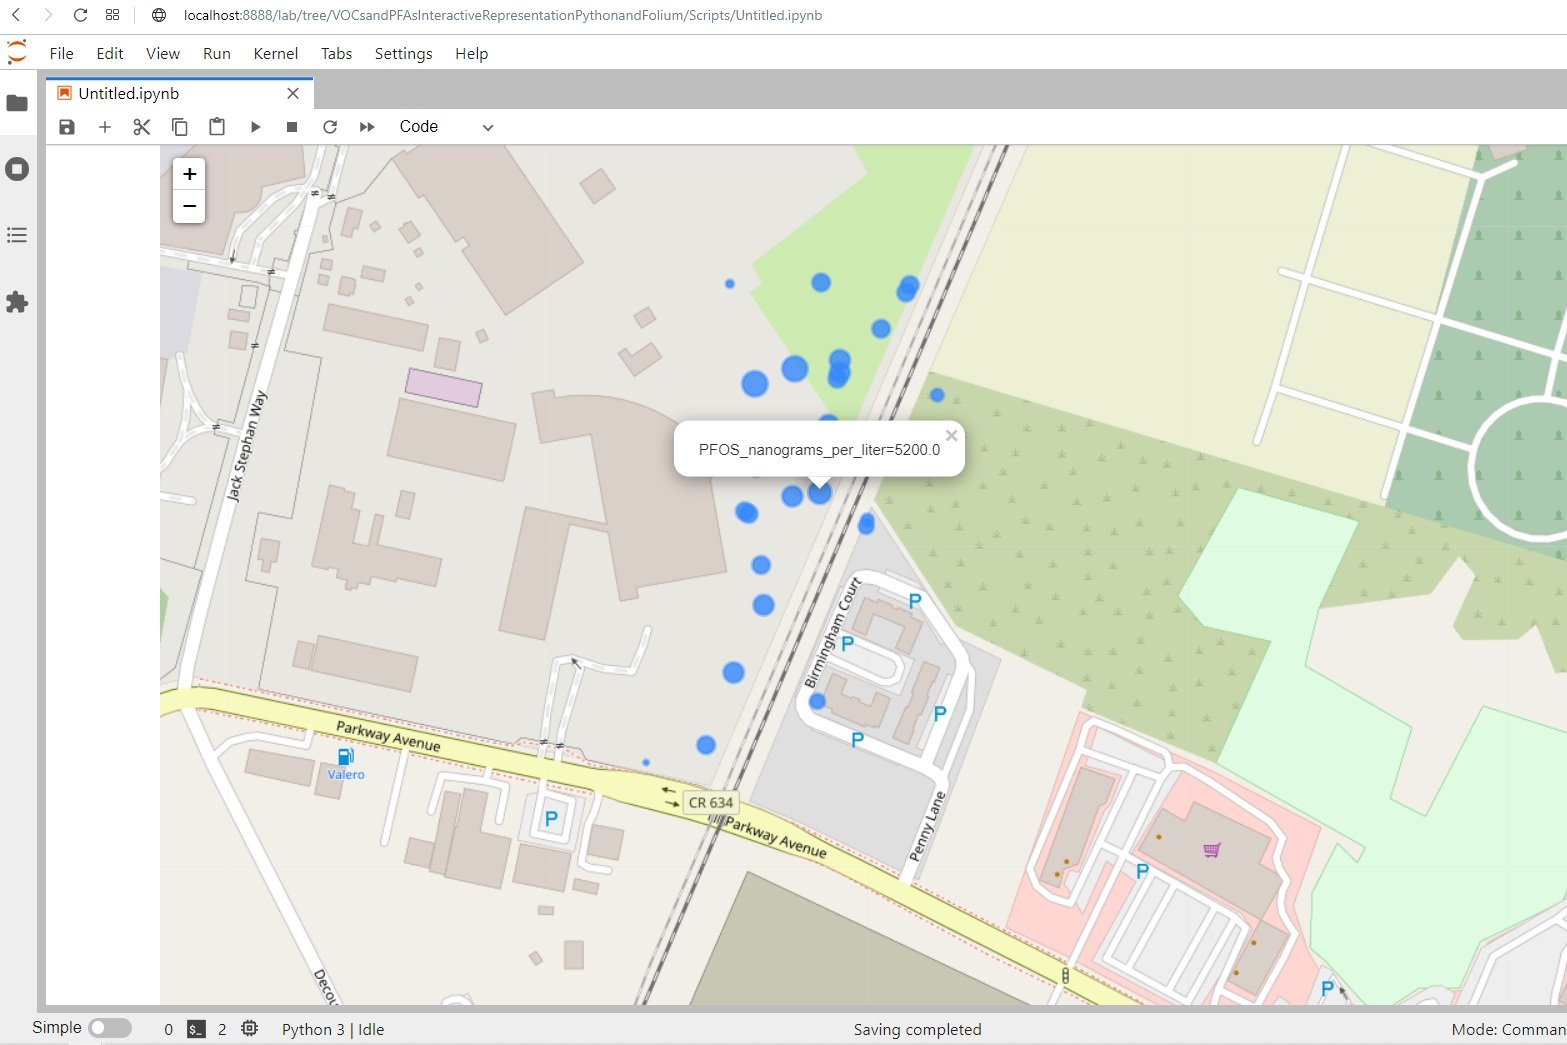
plotSelectedConcentrations(monthData,'PFOS_nanograms_per_liter',16)interact(plotSelectedConcentrations, monthData=fixed(monthData), component=compList, zoomLevel=fixed(16))Input text
You can download the input files from this link.