

How to calculate the Root Mean Square Error (RMSE) of an interpolated pH raster?
/
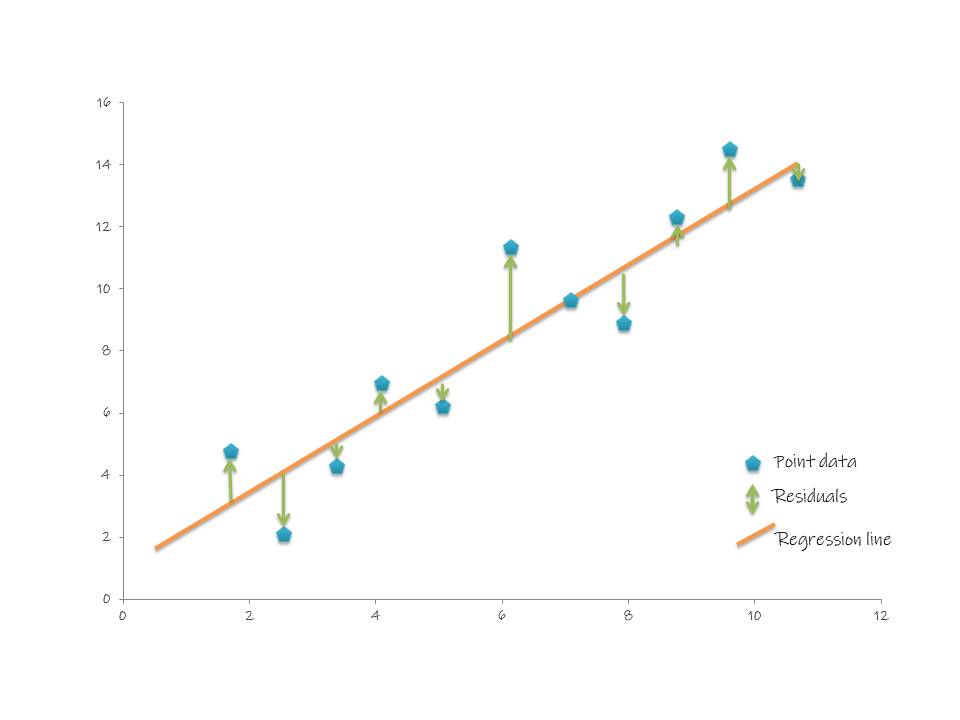
The root mean square error (RMSE) has been used as a standard statistical parameter to measure model performance in several natural sciences. The parameter indicates the standard deviation of the residuals or how far the points are from the regression or modelled line. The following figure shows the residuals as green arrows and its location between the point data and the regression line.
To calculate the RMSE, the following equation is used

Where:
- n: number of samples
- f: forecasts
- o: observed values
The RMSE is a good indicator to evaluate the performance of the interpolation exercises. This tutorial will show how to interpolate pH values in QGIS and how to evaluate the interpolation using the RMSE value. For this instance, the forecasts will be the interpolated values and the observed values will be the samples.
For this exercise, we will divide the point data as follows: 80% for the interpolation process and 20% for Ground Control Points (GCP). To do so, go to the processing toolbox and look for the Random selection tool. The input layer will be the pH one, the selection method will be Percentage of selected features and we will write 20. Click on Run

Right click on the pH layer and Save as GCP, making sure to click on Save only selected features and save it as GCP20.shp

Open the attribute table of pH and click on invert selection.

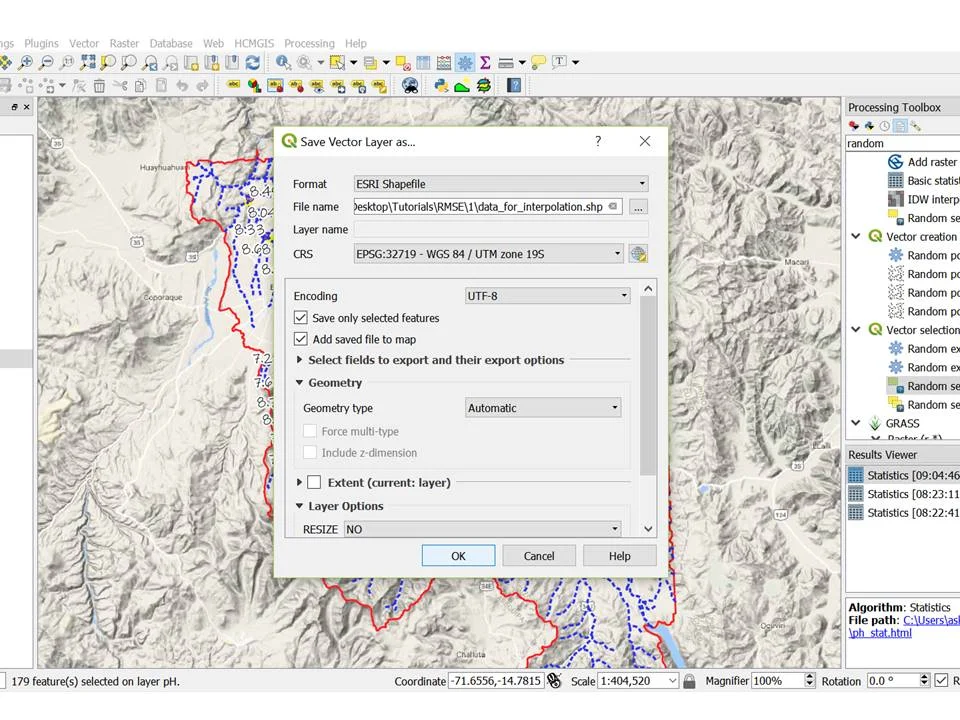
Right click on the pH layer and Save as Data_for_interpolation.shp. This layer will contain the 80% remaining of the data and we will use it to interpolate the data.
To interpolate the pH values, go to QGIS and look for the IDW interpolation tool in the Processing toolbox.

Select the layer that contains the pH information and the attribute that contains the pH values

Click on the three points next to extent and click on Select extent on canvas

Draw a rectangle around the study area

Click on Run in background

Now, install the Point Sampling Tool. Go to Plugins/Install plugins and look for Point Sampling Tool. Click on install plugin.

Go to Plugins/Analyses/Point sampling tool

Select the layer containing sampling points: GCP20 and the layers with fields to get values from will be GCP20 : pH (source point) and the Interpolated: Band 1 (raster)


Click on Browse in the Output point vector layer section and save the file as RMSE.shp

Open the attribute table of the RMSE layer and click on open field calculator

Now we will start calculating the RMSE, to do so, we will calculate the residuals of each ground control point. The GCPs are the observed values and the interpolated values are the forecasts. Therefore, we have to subtract the forecasts from the observed values and square them. Open the attribute table of the RMSE and then Click on Create a New Field, the output field name will be SE and the output field type will be Decimal number (real). Write the following in the expression box: (“Interpolat”-“pH”)^2

Click on toggle editing mode and save changes.

Look for Basic statistics tool in the Processing toolbox and open it.

The input layer will be RMSE.shp and the Field to calculate statistics will be SE. Save the file as pH_SE_stats.

Open the pH_SE_stats and look for the mean value

The mean values for this GCP is 0.3047, now calculate the square root of 0.3047 and the RMSE will be the result. For this instance, the result is 0.552. Therefore, the RMSE of the pH interpolated layer is 0.552.


